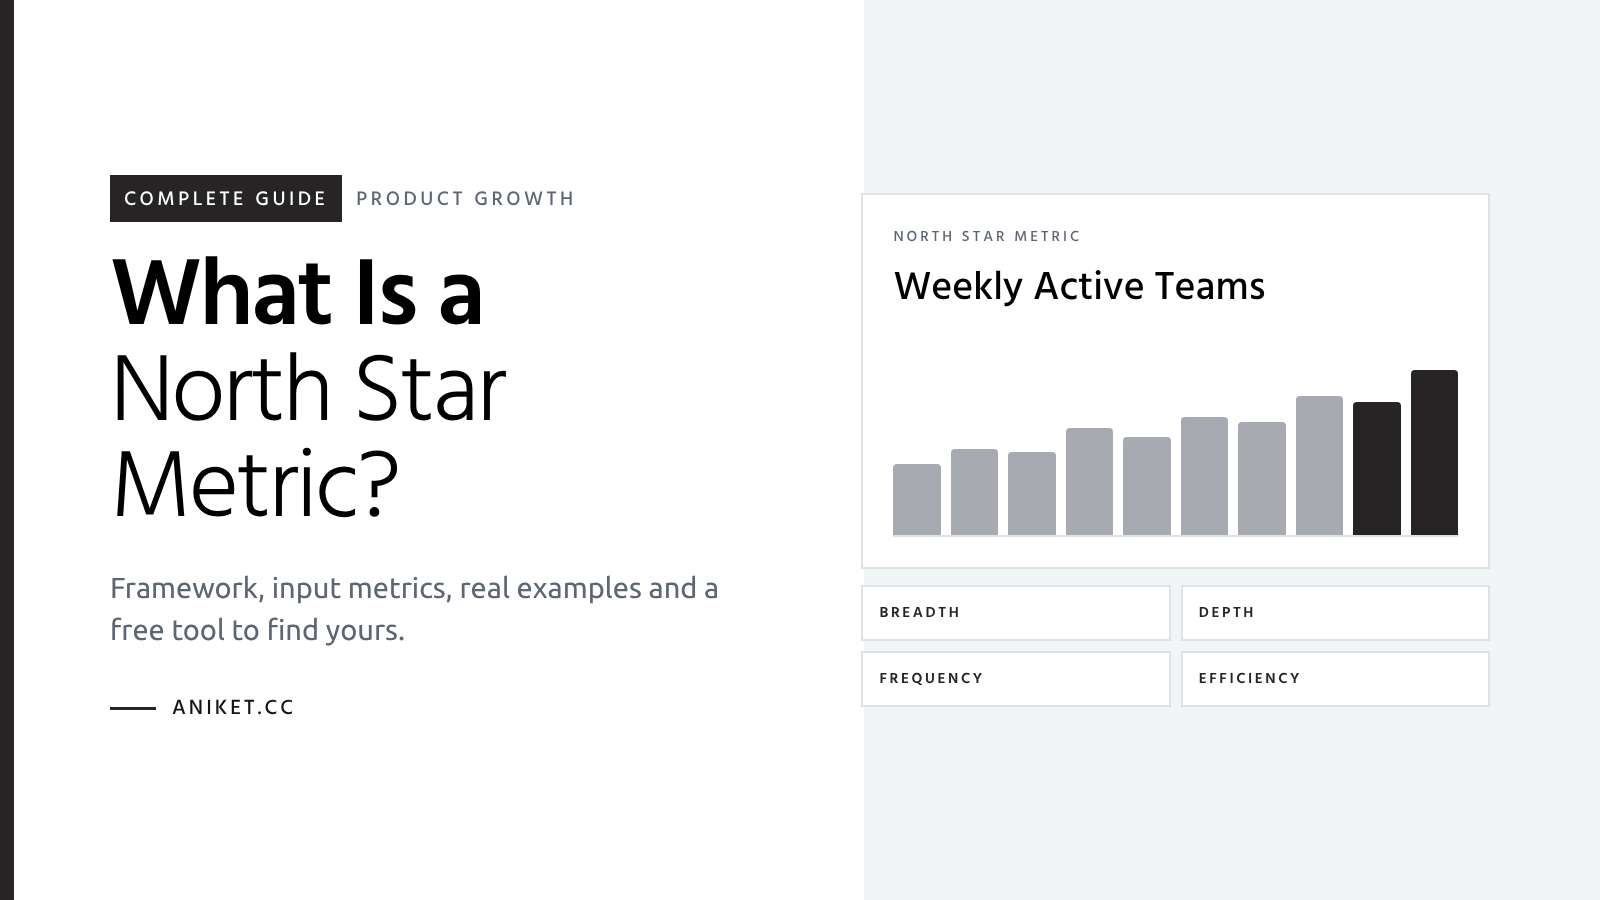
A North Star Metric is the single number that best captures the value your product delivers to customers. When it grows, customers are getting more of what they came for, and revenue tends to follow.
This guide explains what a North Star Metric is, how the North Star Framework works, and how to choose input metrics your teams can actually move. You will see real North Star Metric examples from Airbnb, Asana, Dropbox and others, a six-step process to find your own, and a free North Star Metric Finder that builds a metric, input metrics and a 30-day rollout plan for your product in about two minutes.
Key takeaways
- A North Star Metric measures the value customers get from your product, not just activity or revenue.
- A good North Star is a leading indicator. It moves before revenue does.
- Every North Star is supported by 3 to 5 input metrics, usually covering breadth, depth, frequency and efficiency.
- Pair your North Star with a guardrail metric so you never grow it in a way that hurts customers.
- Vanity metrics like signups, page views or registered users make poor North Stars.
What Is a North Star Metric?
A North Star Metric (NSM) is the one metric that best measures the value customers get from your product and that predicts the company’s long-term growth. It gives every team a shared answer to the question “are we making the product more valuable?”
Growth advisor Sean Ellis, who popularized the idea, describes the North Star Metric as a way to pinpoint when customers experience the value of a product (Intercom). Amplitude, which turned it into the widely used North Star Framework, says the metric should align with customer value, represent the product strategy and act as a leading indicator of future success (Amplitude).
A strong North Star Metric has three properties.
- It measures customer value. It counts the moment a customer gets what they came for, such as a booking completed, a file shared or a task finished.
- It leads revenue. When the North Star rises, revenue and retention rise later. Revenue itself is a result, not a North Star.
- Teams can influence it. Product, growth and engineering teams can move it through a small set of input metrics.
In practice, most North Star Metrics are a count of a value moment inside a time window. Examples include weekly collaborative teams, nights booked or successful deployments per week.
Why Your Product Team Needs a North Star Metric
Without a North Star, teams optimize for their own numbers. Marketing chases signups, sales chases deals, and product ships features that move engagement but not value. A North Star Metric connects all of that work to one outcome customers actually care about.
Amplitude describes the goal of the framework as connecting the customer, the product and the business, so that teams reach clarity, alignment and accountability (Amplitude North Star Playbook). In day-to-day work, that means four practical benefits.
- Faster prioritization. Any feature or experiment can be judged by one question. Which input metric will this move, and by how much?
- Fewer vanity metrics. A shared definition of value makes it obvious when a number grows without helping customers.
- Better cross-team alignment. Product, growth, marketing and data teams work from the same scoreboard.
- Earlier warning signals. Because the North Star leads revenue, a drop shows up weeks or months before it hits the P&L.
North Star Metric vs KPI vs OKR
People often mix up North Star Metrics, KPIs, OKRs and the One Metric That Matters. They work together, but each has a different job.
| Concept | What it is | How many | Time horizon | Example |
|---|---|---|---|---|
| North Star Metric | The one metric that measures customer value and predicts growth | One for the product | Years | Weekly collaborative teams |
| Input metrics | The drivers of the North Star that teams can directly move | 3 to 5 | Weeks to quarters | Share of invited members who become active |
| KPIs | Any metric used to monitor performance and health | Many | Ongoing | Support response time |
| OKRs | A goal-setting system of objectives and measurable key results | A few per team each quarter | Quarterly | Raise team activation from 30% to 40% |
| One Metric That Matters | The metric a team focuses on right now, which changes by stage | One at a time | Weeks to months | Day-7 retention during an onboarding push |
The simplest way to remember it is that the North Star is the destination, input metrics are the levers, OKRs set quarterly targets on those levers, and KPIs monitor everything else.
The North Star Framework Explained
The North Star Framework has four layers. A short value statement describes why customers use the product. The North Star Metric measures that value. Input metrics break the North Star into parts teams can own. Finally, the work, meaning features, experiments and campaigns, is chosen because it moves an input.
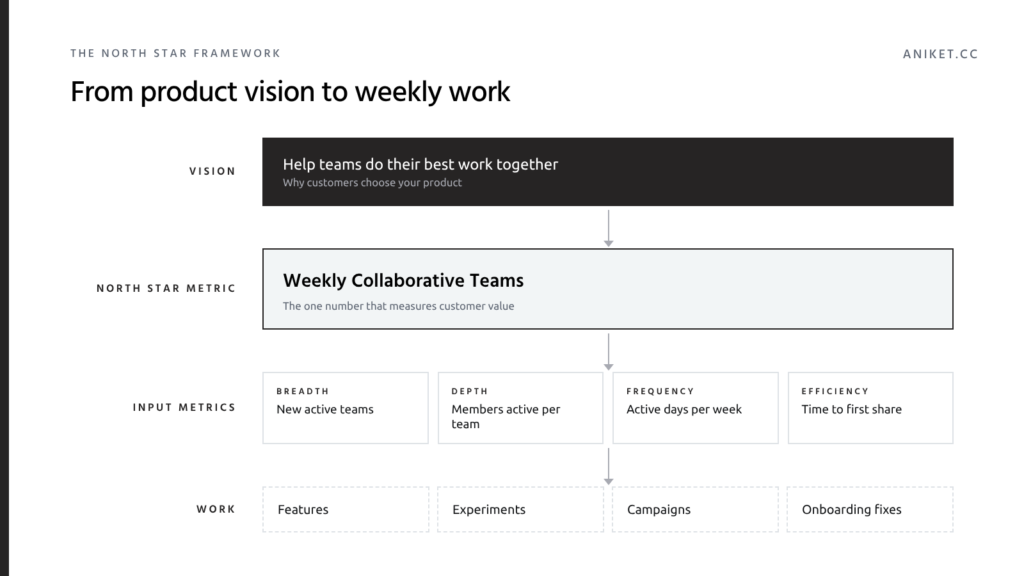
The North Star Framework connects your product vision to the work your teams ship every week.
Input Metrics: Breadth, Depth, Frequency and Efficiency
You rarely move a North Star Metric directly. You move it through input metrics. Amplitude recommends three to five complementary inputs and offers breadth, depth, frequency and efficiency as a useful pattern for choosing them (Amplitude).
| Input dimension | Question it answers | Example for a team collaboration product |
|---|---|---|
| Breadth | How many customers get value? | New teams reaching 3 or more active members |
| Depth | How much value does each customer get? | Share of invited members who become active |
| Frequency | How often do they get it? | Active days per team per week |
| Efficiency | How quickly do they get it? | Time from signup to first shared item |
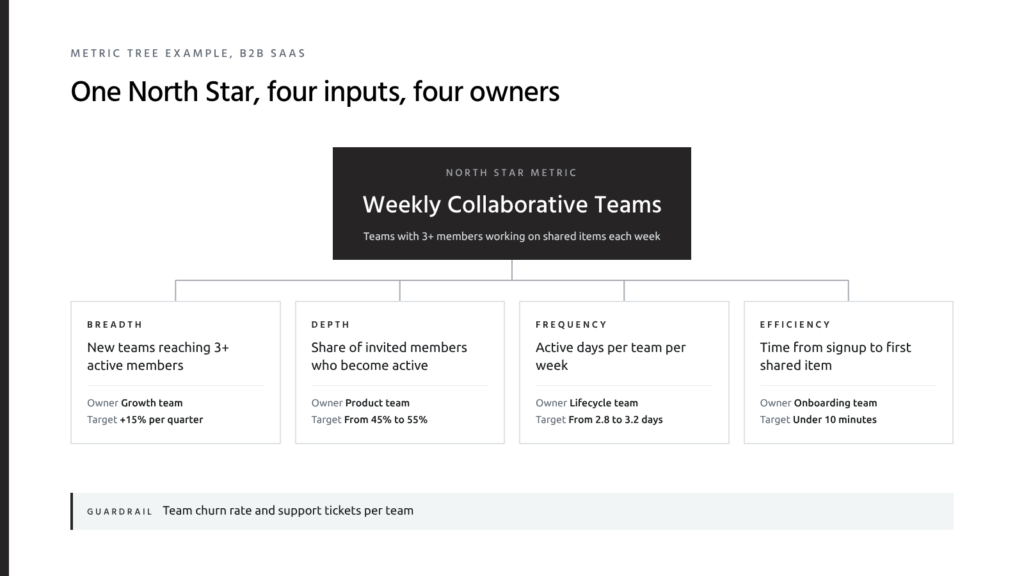
A North Star metric tree. Each input has an owner, a target and a set of experiments.
A metric tree like this is the most practical artifact of the framework. It shows every team which lever they own and how their work rolls up to the North Star.
The Three Games: Attention, Transaction and Productivity
Amplitude groups products into three “games” based on how customers get value. Knowing which game you play narrows down the right North Star quickly (Amplitude).
| Game | What customers value | Typical products | Example North Star (hypothetical, from Amplitude) |
|---|---|---|---|
| Attention | Time spent enjoying content or connecting | Streaming, social, media | Netflix subscribers watching more than X hours per month |
| Transaction | Completing purchases quickly and reliably | E-commerce, marketplaces | Amazon purchases per Prime subscriber |
| Productivity | Getting a job done faster or better | B2B SaaS, tools, developer platforms | Asana average tasks completed per account, Dropbox average files shared per account |
In the productivity game, more time in the product can actually mean less value. That is why B2B tools should usually count completed work, not minutes spent.
North Star Metric Examples From Real Companies
These North Star Metric examples come from the people who shaped the framework and from company reporting. Airbnb reports its metric every quarter, and Sean Ellis names it as Airbnb’s North Star. The other examples come from Sean Ellis or Amplitude. Amplitude describes its own company examples as hypothetical, so treat them as illustrations, not official company statements.
| Company | North Star Metric | Why it works | Source |
|---|---|---|---|
| Airbnb | Nights and Seats Booked | Counts value for guests and hosts, not app installs | Sean Ellis, Intercom interview (metric), and Airbnb Q2 2026 filing, SEC (figures) |
| Facebook (early) | Users adding 7 friends in their first 10 days | Captures the moment a new user experiences the network | Amplitude, product North Star metric guide |
| Daily active users | Sustains the loop of people getting value from others’ content | Sean Ellis, Intercom interview | |
| LogMeIn | Remote control sessions | Each session is the core job customers pay for | Sean Ellis, Intercom interview |
| Asana | Tasks completed per account | Completed work is the productivity value | Amplitude, games of product activity (hypothetical example) |
| Dropbox | Files shared per account | Sharing is where storage becomes collaboration | Amplitude, games of product activity (hypothetical example) |
| Amazon | Purchases per Prime subscriber | Combines loyalty and transaction value | Amplitude, games of product activity (hypothetical example) |
Sean Ellis cites daily active users as Facebook’s North Star, while Amplitude cautions that daily active users alone is usually a weak choice because it counts activity, not value. For a social network, regular visits are close to the value itself, but most products need a more specific value moment.
Case Study: How Airbnb Reports Its North Star Every Quarter
Airbnb reports Nights and Seats Booked every quarter, and Sean Ellis has cited nights booked as Airbnb’s North Star. Airbnb defines Nights and Seats Booked as the total number of nights booked for stays plus seats booked for services and experiences, net of cancellations and alterations (Airbnb Q2 2026 results, SEC).
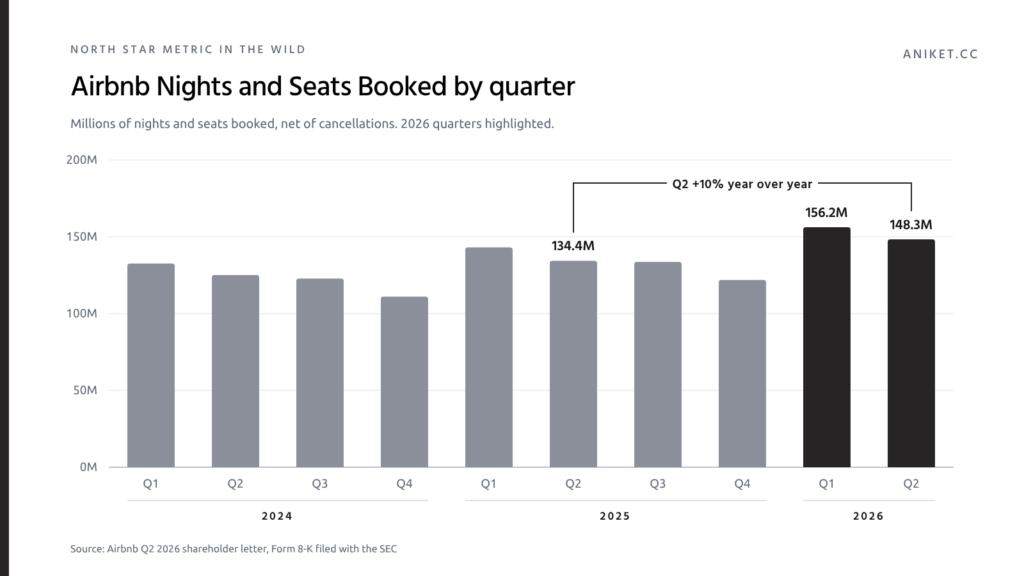
Airbnb Nights and Seats Booked by quarter, in millions. Source Airbnb Q2 2026 shareholder letter.
In Q2 2026, Airbnb reported 148.3 million Nights and Seats Booked, up 10% year over year. Three lessons stand out for any product team.
- Count value units, not dollars. Nights booked grows only when real guests and hosts complete stays. Prices and exchange rates do not inflate it.
- Compare like for like. The metric is seasonal. In every year shown, Q1 is the peak and Q4 the low, so year-over-year comparison tells the real story.
- Expand the definition as the product grows. When Airbnb added services and experiences, the metric expanded to include seats booked, so the North Star kept reflecting the full product.
North Star Metric Examples by Business Model
Most products fit one of these patterns. Use the table as a starting point, then adjust the definition to your own value moment. To get a version tailored to your product, try the North Star Metric Finder.
| Business model | North Star Metric example | Guardrail metric |
|---|---|---|
| B2B SaaS, collaboration | Weekly collaborative teams | Team churn rate |
| B2B SaaS, workflow or automation | Weekly successful automated tasks | Failed run and error rate |
| Marketplace | Weekly completed transactions | Cancellation and dispute rate |
| E-commerce or D2C | Monthly repeat purchasers | Return rate |
| Consumer social or community | Weekly interacting users | Reports and blocks |
| Content, media or learning | Weekly learners completing a session | Early churn |
| Fintech or payments | Weekly successful payment transactions | Fraud and chargeback rate |
| Developer tool or API | Weekly active production integrations | API error rate and latency |
| AI product or AI feature | Weekly accepted AI outputs | Regenerate rate and cost per output |
| Web3 or blockchain | Weekly active transacting wallets, excluding bots | Share of sybil or bot activity |
How to Find Your North Star Metric in 6 Steps
1. Define the value moment
Write down the exact moment a customer thinks “this was worth it.” For a marketplace it is a completed booking. For a collaboration tool it is a teammate opening shared work. For an AI assistant it is an output the user keeps.
2. Identify which game you play
Decide whether customers mainly value attention, transactions or productivity. This tells you whether to count time, completed purchases or completed work.
3. Turn the value moment into a countable metric
Pick the unit (users, teams, accounts or events) and a time window that matches how often a happy customer gets value. Daily and weekly products use a weekly window. Monthly products use a monthly or rolling 28-day window. Occasional products use a quarterly window.
4. Test it against five criteria
A good North Star passes all five checks in the checklist below. If it fails one, adjust the definition before you roll it out. You can also score your metric against these checks in the free tool.
5. Map 3 to 5 input metrics
Break the North Star into breadth, depth, frequency and efficiency inputs, and give each input an owner. Most roadmap decisions should then be framed around one input.
6. Add a guardrail and instrument it
Choose a guardrail metric that would reveal unhealthy growth, such as cancellations, error rates or spam reports. Then track the core event in your analytics tool and check the counts against your database before anyone sets targets.
Free North Star Metric Finder Tool
Skip the blank page. Answer five quick questions about your product, how customers get value and how you make money. The tool suggests a North Star Metric, four input metrics, a guardrail, a measurement spec and a 30-day rollout plan. You can rename the metric, score it, download it as a PDF or share a link with your team.
Find your North Star Metric in 2 minutes
Answer 5 quick questions and get your North Star Metric, input metrics, a guardrail and a 30-day plan. Download it as a PDF or share it with your team.
Open the North Star Metric Finder → Free. No signup needed.How to Choose a North Star Metric for AI Products
AI products need extra care because it is easy to measure the model instead of the product. Guidance from the Institute of Product Management recommends choosing a North Star that reflects real user value and the AI’s actual contribution, and pairing it with quality guardrails (Institute of Product Management).
- Do not use model accuracy as the North Star. Accuracy measures the model, not whether users got value.
- Do not use engagement alone. Prompts sent or tokens used can grow while answers get worse.
- Count accepted or completed outcomes. Examples include accepted suggestions per active developer per week, or support tickets resolved by AI with no reopen within 7 days.
- Add quality and cost guardrails. Track hallucination or reject rates and cost per accepted output so growth stays healthy.
Leading vs Lagging Indicators
Revenue, ARR and ARPU are lagging indicators. They tell you what already happened. A North Star Metric should be a leading indicator that moves first, giving you time to act. Amplitude explicitly contrasts the North Star with lagging metrics such as monthly revenue (Amplitude).
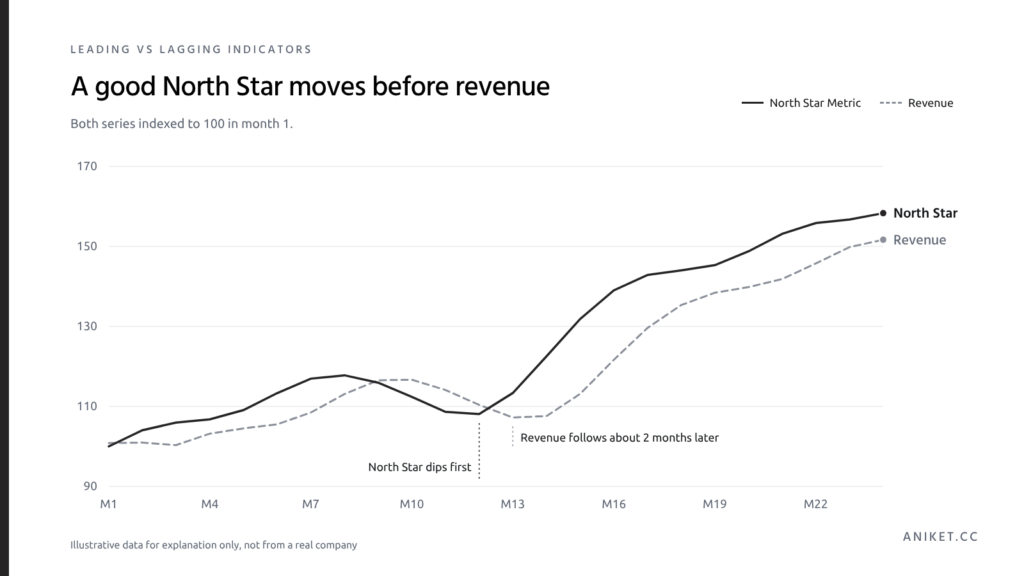
Illustrative example. A healthy North Star moves first, and revenue follows with a lag.
To test whether your candidate metric leads revenue, chart both over the last 12 to 24 months. If changes in the North Star show up in revenue a few weeks or months later, you have a leading indicator. If revenue moves first, look for an action earlier in the customer journey.
Common North Star Metric Mistakes
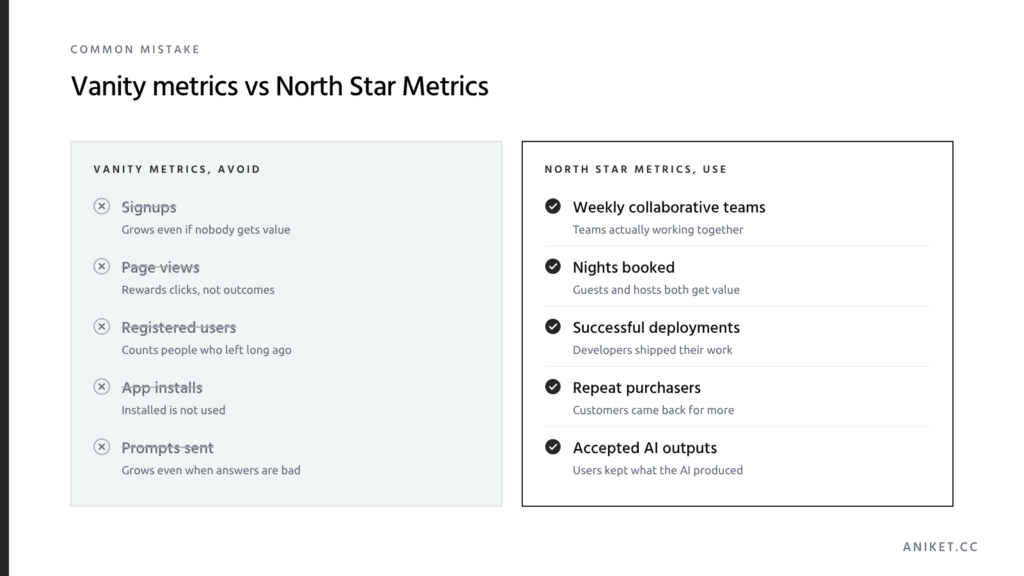
Vanity metrics grow without proving value. North Star Metrics only grow when customers win.
- Choosing a vanity metric. Signups, registered users and page views can rise while customers get nothing. Amplitude calls out daily active users and registered users as poor choices when they do not reflect what customers value.
- Using revenue as the North Star. Revenue is the outcome of delivering value, and it lags. It also moves with pricing changes that have nothing to do with customer value.
- Picking a metric no team can influence. If nobody can name an input they own, the North Star becomes a report, not a guide.
- Having several North Stars. Multiple North Stars recreate the alignment problem the framework solves. Use one North Star and several inputs.
- Skipping the guardrail. Any metric that becomes a target can be gamed, a pattern known as Goodhart’s law. A guardrail keeps growth honest.
- Never revisiting it. Review the North Star when your strategy, product or business model changes, as Airbnb did when it added services and experiences.
How to Roll Out Your North Star Metric in 30 Days
- Week 1. Track the core event in your analytics tool and check the counts against your database.
- Week 2. Backfill as much history as possible and chart the North Star by week or month to set a baseline.
- Week 3. Give each input metric an owner and agree on one experiment per input.
- Week 4. Set a target for next quarter and add the North Star and its guardrail to your weekly review.
North Star Metric Checklist
Before you commit, make sure your North Star passes every check.
- It measures value customers get, not just activity you want.
- It moves before revenue does, so it works as a leading indicator.
- Every team can name an input metric they can influence.
- Anyone in the company can explain it in one sentence.
- You can measure it reliably from your data today.
Want a guided version? The free North Star Metric toolscores your metric against all five checks.
Frequently Asked Questions About North Star Metrics
What is a North Star Metric in simple terms?
A North Star Metric is the one number that shows whether customers are getting real value from your product. When it goes up, customers are succeeding, and the business usually grows as a result.
What is a good North Star Metric example?
Airbnb’s Nights and Seats Booked is one of the clearest examples. It counts completed stays and experiences, which is value for both guests and hosts, and Airbnb reports it every quarter.
Can a company have more than one North Star Metric?
A single product should have one North Star Metric. Large companies with very different products sometimes set one North Star per product line, but each team still works toward a single metric.
Is revenue a good North Star Metric?
Usually not. Revenue is a lagging result of customer value and can change because of pricing alone. A good North Star should predict revenue rather than be revenue.
How many input metrics should a North Star Metric have?
Most teams use three to five input metrics. Breadth, depth, frequency and efficiency are a simple way to cover the main drivers.
How often should you change your North Star Metric?
Rarely. Review it every year or whenever your strategy or business model changes significantly. Changing it every quarter defeats the purpose of a shared long-term goal.
What is the difference between a North Star Metric and the One Metric That Matters?
The North Star Metric is a long-term measure of customer value for the whole company. The One Metric That Matters is a short-term focus metric for a team or stage, such as activation during an onboarding push, and it changes as priorities change.
What is a good North Star Metric for a SaaS product?
For collaboration SaaS, weekly active teams with three or more members is a strong choice. For workflow and automation SaaS, count successful completed tasks or accounts achieving their core outcome each week.
Final Thoughts
A North Star Metric is not a dashboard number. It is a decision-making tool that tells every team what value means and how their work contributes to it. Start with the value moment, make it countable, map the inputs and protect it with a guardrail.
If you want a head start, use the free North Star Metric Finder to get a metric, input metrics and a 30-day plan for your product, then refine it with your team.
Disclaimer: This article and the North Star Metric Finder are provided for educational and informational purposes only and do not constitute professional, financial, or business advice. Company examples come from third-party sources, including Sean Ellis and Amplitude. Amplitude describes its own company examples as hypothetical, so they are illustrations and not official company statements. Financial and usage figures, such as Airbnb’s Nights and Seats Booked, come from public filings and may be updated or revised. The tool’s output is a starting suggestion based on your answers, so test any metric against your own data and business context before adopting it. All trademarks belong to their respective owners, and no affiliation with or endorsement by the companies mentioned is implied.

I write about product growth, data, and AI, and how to use AI to grow your products, from strategy to analytics.
